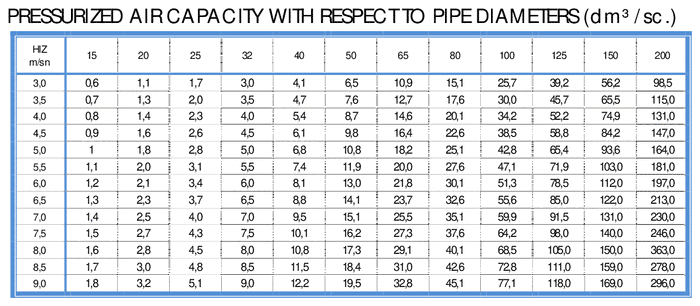
Compressed Air Pipe Capacity Table
CONTENTS
Our Products
Compressed Air Pipe Capacity Table (DN 15 – DN 200)
Compressed air pipe capacity is set by the pipe cross-section and by the air velocity the line is allowed to run at. Check the capacity of the existing line against the demand before adding compressor output — an undersized main shows up as pressure drop at the tool, not at the compressor.
Volumetric capacity of compressed air in dm³/s for a given flow velocity and nominal pipe diameter. Use it to check that an existing line can carry the required air flow before increasing compressor output.
| Speed (m/s) | DN 15 | DN 20 | DN 25 | DN 32 | DN 40 | DN 50 | DN 65 | DN 80 | DN 100 | DN 125 | DN 150 | DN 200 |
|---|---|---|---|---|---|---|---|---|---|---|---|---|
| 3.0 | 0.6 | 1.1 | 1.7 | 3.0 | 4.1 | 6.5 | 10.9 | 15.1 | 25.7 | 39.2 | 56.2 | 98.5 |
| 3.5 | 0.7 | 1.3 | 2.0 | 3.5 | 4.7 | 7.6 | 12.7 | 17.6 | 30.0 | 45.7 | 65.5 | 115.0 |
| 4.0 | 0.8 | 1.4 | 2.3 | 4.0 | 5.4 | 8.7 | 14.6 | 20.1 | 34.2 | 52.2 | 74.9 | 131.0 |
| 4.5 | 0.9 | 1.6 | 2.6 | 4.5 | 6.1 | 9.8 | 16.4 | 22.6 | 38.5 | 58.8 | 84.2 | 147.0 |
| 5.0 | 1 | 1.8 | 2.8 | 5.0 | 6.8 | 10.8 | 18.2 | 25.1 | 42.8 | 65.4 | 93.6 | 164.0 |
| 5.5 | 1.1 | 2.0 | 3.1 | 5.5 | 7.4 | 11.9 | 20.0 | 27.6 | 47.1 | 71.9 | 103.0 | 181.0 |
| 6.0 | 1.2 | 2.1 | 3.4 | 6.0 | 8.1 | 13.0 | 21.8 | 30.1 | 51.3 | 78.5 | 112.0 | 197.0 |
| 6.5 | 1.3 | 2.3 | 3.7 | 6.5 | 8.8 | 14.1 | 23.7 | 32.6 | 55.6 | 85.0 | 122.0 | 213.0 |
| 7.0 | 1.4 | 2.5 | 4.0 | 7.0 | 9.5 | 15.1 | 25.5 | 35.1 | 59.9 | 91.5 | 131.0 | 230.0 |
| 7.5 | 1.5 | 2.7 | 4.3 | 7.5 | 10.1 | 16.2 | 27.3 | 37.6 | 64.2 | 98.0 | 140.0 | 246.0 |
| 8.0 | 1.6 | 2.8 | 4.5 | 8.0 | 10.8 | 17.3 | 29.1 | 40.1 | 68.5 | 105.0 | 150.0 | 363.0 |
| 8.5 | 1.7 | 3.0 | 4.8 | 8.5 | 11.5 | 18.4 | 31.0 | 42.6 | 72.8 | 111.0 | 159.0 | 278.0 |
| 9.0 | 1.8 | 3.2 | 5.1 | 9.0 | 12.2 | 19.5 | 32.8 | 45.1 | 77.1 | 118.0 | 169.0 | 296.0 |
Values are for the pipe cross-section at the stated velocity. 1 dm³/s = 3.6 m³/h = 60 l/min.
What the Compressed Air Pipe Capacity Table Assumes
The dm³/s figures give the volume moving inside the pipe at line pressure, not free air delivery. This is where most sizing errors start: a compressor rated at 50 dm³/s FAD is quoted at atmospheric conditions, while the compressed air pipe capacity table describes air that has already been compressed. At 7 bar gauge the air occupies roughly one eighth of its free volume, so 50 dm³/s of free air is only about 6 dm³/s inside the main. Convert the demand to line conditions first, then read the compressed air pipe capacity against it.
Choosing the Velocity Column
The table runs from 3.0 to 9.0 m/s, but not every column is a sensible design point. For headers and ring mains, take the compressed air pipe capacity at 6 m/s or below: pressure drop rises with the square of the velocity, and a main is a permanent installation that is paid for in compressor energy every hour it runs. The 8 to 9 m/s columns belong to short drops and hose connections, where the run is short enough that the extra drop does not matter.
Velocity also decides what the air carries. Above roughly 9 m/s a line picks up condensate and oil film from the pipe wall and delivers both to the tool. Holding the compressed air pipe capacity in the 4 to 6 m/s band is what keeps the air dry at the point of use.
Pressure Drop Is the Real Budget
A distribution system should lose no more than about 0.1 bar between the receiver and the furthest tool. Every additional bar the compressor has to generate costs roughly 7 % more energy, so a line chosen at the very top of its compressed air pipe capacity is paid for twice: once in pipe, and then continuously in electricity. Going one nominal size up is almost always cheaper over the life of the installation than the pressure it saves.
A Ring Main Halves the Duty
A ring fed from both ends splits the flow, so each leg carries about half the demand and the compressed air pipe capacity required per leg falls accordingly — usually by one nominal diameter. A ring also keeps the supply alive while a branch is isolated for maintenance, which is why it earns the extra pipe on any installation with more than a few take-off points.
Fittings, Valves and Leaks
The table describes straight pipe. Every elbow, tee and valve adds an equivalent length: at DN 25 an elbow behaves like roughly 1.5 m of extra pipe and a globe valve like a great deal more, while a full-bore ball valve adds almost nothing. Sizing a line correctly and then fitting a reduced-bore shut-off valve throws away the compressed air pipe capacity that was just paid for.
Leakage is the other quiet loss. A single 1 mm hole at 7 bar releases roughly 1 dm³/s of free air, and ten such holes approach the output of a small 5.5 kW compressor. Before deciding that a line is short of compressed air pipe capacity, shut the system overnight and measure how much of the shortfall is simply leaking away.
Material matters less than diameter, but it is not neutral. Internal corrosion in older galvanised steel roughens the bore and reduces the effective compressed air pipe capacity over the years, which is why a line that was correct when installed can fall short without anything else having changed. Aluminium and stainless systems hold their bore, so the table stays valid for the life of the pipe.
Reading the Table with the Related Charts
Once the required compressed air pipe capacity is known, the bands in the recommended pipe flow velocity table confirm the choice against the other services in the plant, and the pipe flow diagram does the same job for water and other liquids. Note that 1 dm³/s = 3.6 m³/h = 60 l/min, so a demand quoted in m³/h can be compared with the compressed air pipe capacity columns directly.