

Steam Capacity With Respect To Pipe Diameters
CONTENTS
Our Products
Steam Pipe Capacity Table (DN 15 – DN 300)
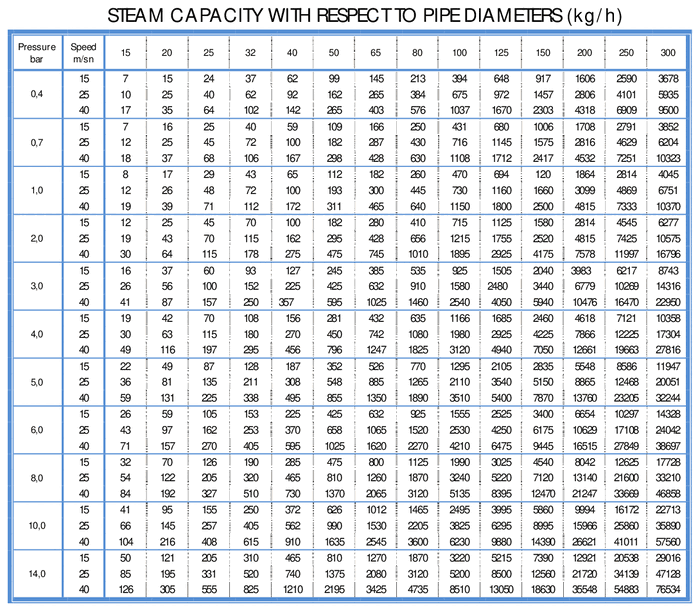
This steam pipe capacity table gives the throughput in kg/h that each nominal diameter carries at a given gauge pressure and steam velocity. It is the first check before sizing a steam valve or a trap: the same DN carries several times more steam at 14 bar than at 0.4 bar.
Steam throughput in kg/h for nominal pipe diameters DN 15–300, at gauge pressures from 0.4 to 14 bar and steam velocities of 15, 25 and 40 m/s.
| Pressure (bar) | Speed (m/s) | DN 15 | DN 20 | DN 25 | DN 32 | DN 40 | DN 50 | DN 65 | DN 80 | DN 100 | DN 125 | DN 150 | DN 200 | DN 250 | DN 300 |
|---|---|---|---|---|---|---|---|---|---|---|---|---|---|---|---|
| 0.4 | 15 | 7 | 15 | 24 | 37 | 62 | 99 | 145 | 213 | 394 | 648 | 917 | 1606 | 2590 | 3678 |
| 25 | 10 | 25 | 40 | 62 | 92 | 162 | 265 | 384 | 675 | 972 | 1457 | 2806 | 4101 | 5935 | |
| 40 | 17 | 35 | 64 | 102 | 142 | 265 | 403 | 576 | 1037 | 1670 | 2303 | 4318 | 6909 | 9500 | |
| 0.7 | 15 | 7 | 16 | 25 | 40 | 59 | 109 | 166 | 250 | 431 | 680 | 1006 | 1708 | 2791 | 3852 |
| 25 | 12 | 25 | 45 | 72 | 100 | 182 | 287 | 430 | 716 | 1145 | 1575 | 2816 | 4629 | 6204 | |
| 40 | 18 | 37 | 68 | 106 | 167 | 298 | 428 | 630 | 1108 | 1712 | 2417 | 4532 | 7251 | 10323 | |
| 1.0 | 15 | 8 | 17 | 29 | 43 | 65 | 112 | 182 | 260 | 470 | 694 | 120 | 1864 | 2814 | 4045 |
| 25 | 12 | 26 | 48 | 72 | 100 | 193 | 300 | 445 | 730 | 1160 | 1660 | 3099 | 4869 | 6751 | |
| 40 | 19 | 39 | 71 | 112 | 172 | 311 | 465 | 640 | 1150 | 1800 | 2500 | 4815 | 7333 | 10370 | |
| 2.0 | 15 | 12 | 25 | 45 | 70 | 100 | 182 | 280 | 410 | 715 | 1125 | 1580 | 2814 | 4545 | 6277 |
| 25 | 19 | 43 | 70 | 115 | 162 | 295 | 428 | 656 | 1215 | 1755 | 2520 | 4815 | 7425 | 10575 | |
| 40 | 30 | 64 | 115 | 178 | 275 | 475 | 745 | 1010 | 1895 | 2925 | 4175 | 7578 | 11997 | 16796 | |
| 3.0 | 15 | 16 | 37 | 60 | 93 | 127 | 245 | 385 | 535 | 925 | 1505 | 2040 | 3983 | 6217 | 8743 |
| 25 | 26 | 56 | 100 | 152 | 225 | 425 | 632 | 910 | 1580 | 2480 | 3440 | 6779 | 10269 | 14316 | |
| 40 | 41 | 87 | 157 | 250 | 357 | 595 | 1025 | 1460 | 2540 | 4050 | 5940 | 10476 | 16470 | 22950 | |
| 4.0 | 15 | 19 | 42 | 70 | 108 | 156 | 281 | 432 | 635 | 1166 | 1685 | 2460 | 4618 | 7121 | 10358 |
| 25 | 30 | 63 | 115 | 180 | 270 | 450 | 742 | 1080 | 1980 | 2925 | 4225 | 7866 | 12225 | 17304 | |
| 40 | 49 | 116 | 197 | 295 | 456 | 796 | 1247 | 1825 | 3120 | 4940 | 7050 | 12661 | 19663 | 27816 | |
| 5.0 | 15 | 22 | 49 | 87 | 128 | 187 | 352 | 526 | 770 | 1295 | 2105 | 2835 | 5548 | 8586 | 11947 |
| 25 | 36 | 81 | 135 | 211 | 308 | 548 | 885 | 1265 | 2110 | 3540 | 5150 | 8865 | 12468 | 20051 | |
| 40 | 59 | 131 | 225 | 338 | 495 | 855 | 1350 | 1890 | 3510 | 5400 | 7870 | 13760 | 23205 | 32244 | |
| 6.0 | 15 | 26 | 59 | 105 | 153 | 225 | 425 | 632 | 925 | 1555 | 2525 | 3400 | 6654 | 10297 | 14328 |
| 25 | 43 | 97 | 162 | 253 | 370 | 658 | 1065 | 1520 | 2530 | 4250 | 6175 | 10629 | 17108 | 24042 | |
| 40 | 71 | 157 | 270 | 405 | 595 | 1025 | 1620 | 2270 | 4210 | 6475 | 9445 | 16515 | 27849 | 38697 | |
| 8.0 | 15 | 32 | 70 | 126 | 190 | 285 | 475 | 800 | 1125 | 1990 | 3025 | 4540 | 8042 | 12625 | 17728 |
| 25 | 54 | 122 | 205 | 320 | 465 | 810 | 1260 | 1870 | 3240 | 5220 | 7120 | 13140 | 21600 | 33210 | |
| 40 | 84 | 192 | 327 | 510 | 730 | 1370 | 2065 | 3120 | 5135 | 8395 | 12470 | 21247 | 33669 | 46858 | |
| 10.0 | 15 | 41 | 95 | 155 | 250 | 372 | 626 | 1012 | 1465 | 2495 | 3995 | 5860 | 9994 | 16172 | 22713 |
| 25 | 66 | 145 | 257 | 405 | 562 | 990 | 1530 | 2205 | 3825 | 6295 | 8995 | 15966 | 25860 | 35890 | |
| 40 | 104 | 216 | 408 | 615 | 910 | 1635 | 2545 | 3600 | 6230 | 9880 | 14390 | 26621 | 41011 | 57560 | |
| 14.0 | 15 | 50 | 121 | 205 | 310 | 465 | 810 | 1270 | 1870 | 3220 | 5215 | 7390 | 12921 | 20538 | 29016 |
| 25 | 85 | 195 | 331 | 520 | 740 | 1375 | 2080 | 3120 | 5200 | 8500 | 12560 | 21720 | 34139 | 47128 | |
| 40 | 126 | 305 | 555 | 825 | 1210 | 2195 | 3425 | 4735 | 8510 | 13050 | 18630 | 35548 | 54883 | 76534 |
Higher velocities allow a smaller pipe but increase pressure drop, noise and erosion. 15–25 m/s is usual for saturated steam distribution; 40 m/s only for short runs.
How the Steam Pipe Capacity Table Is Built
Each figure is the pipe cross-section multiplied by the steam velocity and divided by the specific volume of saturated steam at that pressure. That last term is why the steam pipe capacity table climbs so steeply across the page: at 0.4 bar gauge saturated steam occupies about 1.24 m³/kg, while at 14 bar it occupies only 0.132 m³/kg. The same DN 50 line therefore carries roughly nine times the mass flow at 14 bar that it carries at 0.4 bar, at an identical velocity. Read the steam pipe capacity table at the pressure the line actually runs at, never at the boiler rating.
Which Velocity Column to Use
For saturated steam distribution, take the 15 or 25 m/s columns of the steam pipe capacity table. The 40 m/s column belongs to short runs and connections, where the pressure drop over the length is small enough to ignore. Dry superheated steam tolerates the higher figures better, because there are no water droplets in the flow. With saturated steam at 40 m/s any carried moisture reaches elbows and valve seats as a jet of droplets, and the capacity gained by choosing the smaller pipe is paid back in erosion within a few years.
The Table Assumes Dry Saturated Steam
Every value in the steam pipe capacity table is for dry saturated steam. Wet steam carries less energy per kilogram, so a line that matches the steam pipe capacity table on paper can still fail to deliver the heat the process needs. Where the supply is known to be wet, fit a separator and a trap set before the branch rather than opening out the pipe size: a larger pipe lowers the velocity and drops even more water out of suspension.
Warm-up Load Is Not Running Load
A cold steam main condenses a great deal of steam while it heats up — several times the running load for the first minutes. The steam pipe capacity table describes the running condition, so a line sized from it alone still needs drain points for the start-up condensate: at the foot of every riser, ahead of every control valve, and every 30 to 50 m along a horizontal run. Opening the isolating valve slowly matters as much as the diameter taken from the steam pipe capacity table; a full-bore valve snapped open on a cold main is the classic cause of water hammer.
Do Not Size the Valve From the Pipe
The steam pipe capacity table gives a pipe diameter, not a valve size. A control valve is sized from the required kg/h and the pressure drop available across it, and the answer is very often one or two sizes below the line. Fitting a line-size control valve because the steam pipe capacity table produced a DN 100 main leaves the valve throttling close to its seat, which is noisy and wears the trim quickly. Isolating valves are the opposite case: they should be full bore and line size, so that they add nothing to the drop the steam pipe capacity table assumes.
Check the Lowest Working Pressure
Plant pressure varies. If a main is reduced to 3 bar for part of the plant, the steam pipe capacity table has to be read again at 3 bar for that section, where the same diameter carries far less steam. Read against the reduced pressure, the steam pipe capacity table makes that shortfall obvious before it is built in. Sizing every branch from the boiler pressure is the most common way to end up with a starved user at the far end of an otherwise adequate system.
Related Steam Tables
The steam pipe capacity table answers the flow question; the property questions sit next to it. The steam saturation temperature table gives the temperature that belongs to each pressure, which in turn sets the flange class and the gasket and packing materials, while the saturated steam table gives the enthalpy needed to turn a heat duty into kg/h — the number the steam pipe capacity table needs before it can be used at all. For water and other liquids the equivalent chart is the recommended pipe flow velocity table.
Reference: IAPWS IF-97 — industrial formulation for the thermodynamic properties of water and steam

